

A picture is worth a thousand words. Every business presentation, every technical document, every strategy meeting either lives or dies by how clearly the ideas inside it are communicated. The trouble is that creating good visuals has traditionally been slow, fiddly, and dependent on specialist software. Most of us end up either using rough hand-drawn sketches or burning hours wrestling with diagramming tools that promise simplicity and never quite deliver it.
There’s a better way that, until fairly recently, only developers and technical writers really knew about. It’s called Mermaid, and it’s worth every business owner, leader and communicator getting familiar with it.
What Mermaid actually is
Mermaid is a tool that lets you create diagrams by writing simple text instead of dragging and dropping shapes around a screen. You describe what you want in a few lines of plain language, and Mermaid renders a clean, professional diagram for you.
It can produce a wide range of diagram types, including:
- Flowcharts
- Sequence diagrams
- Gantt charts
- Class diagrams
- State diagrams
- Entity-relationship diagrams (ERDs)
- User journey diagrams
The beauty of it is the simplicity. You don’t need to be a designer. You don’t need to learn complicated software. You just need to describe what you’re trying to show, and the tool does the rest.
And here’s the genuinely useful part. You don’t even need to learn the Mermaid syntax yourself. Modern AI tools can generate the code for you in seconds.
Creating your first chart with AI assistance
Here’s the practical workflow.
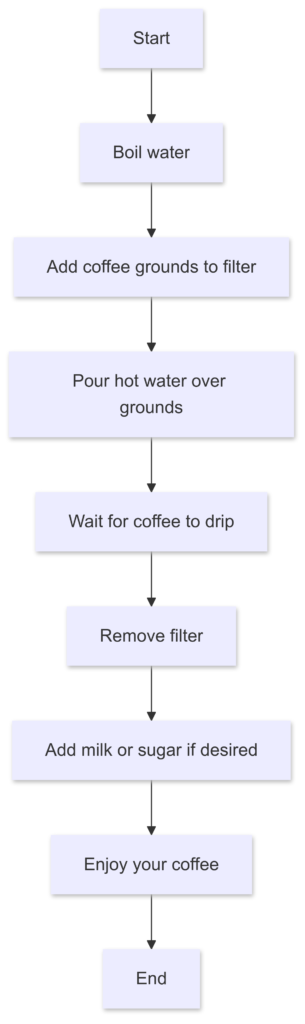 Step 1: Ask an AI to generate the Mermaid code.
Open ChatGPT, Claude, or any other AI assistant and prompt it with something simple like: “Create Mermaid code for a flowchart showing the process of making a cup of coffee.”
You’ll get back something like this:
graph TD
A[Start] --> B[Boil water]
B --> C[Add coffee grounds to filter]
C --> D[Pour hot water over grounds]
D --> E[Wait for coffee to drip]
E --> F[Remove filter]
F --> G[Add milk or sugar if desired]
G --> H[Enjoy your coffee]
H --> I[End]
You don’t need to understand the syntax to use it. Just copy the code.
Step 2: Drop it into the Mermaid Live Editor.
Go to mermaid.live. Paste the code into the left-hand panel. The diagram will appear instantly in the right-hand panel. Adjustments to the code update the chart in real time.
Step 3: Customise it.
A few simple tweaks make a big difference.
- Change node shapes by altering the brackets. Square brackets are rectangles, parentheses are rounded rectangles, curly braces are diamonds.
- Add colour by appending styling like
A[Start]:::greento a node. - Switch the direction of the chart by changing
TD(top-down) toLR(left-right) in the first line.
Step 4: Export or share it.
Use the “Download SVG” button to save the diagram as an image. Or copy the shareable link to send a live, editable version to colleagues.
That’s the whole workflow. From idea to professional diagram in less than five minutes, with no design skills required.
A different way of thinking about diagrams
Using Mermaid changes how you think about creating visuals, in a way I’ve found genuinely useful.
When you have to write the structure of a diagram out in text first, you can’t hide behind aesthetics. You have to actually understand the logical flow. The boxes and arrows can’t paper over fuzzy thinking. If your diagram doesn’t make sense in code, it doesn’t make sense conceptually either.
Three quiet benefits of this approach:
- Clarity of thought. Writing the diagram in text forces you to think through structure and relationships before worrying about how it looks. Most diagrams improve as a result.
- Version control friendly. Because the diagrams are just text, they can be tracked in any version control system, just like code or documentation. You can see exactly what changed and when.
- Accessibility. Screen readers can interpret text-based diagrams in ways they can’t always handle traditional images, making your content more inclusive.
The bigger picture
Mermaid is part of a broader shift towards democratising visual communication. Traditional diagramming tools often required specialist software, paid licences, and a learning curve. Mermaid removes all of that. Anyone who can write a sentence can now create a clean, professional diagram.
Three implications worth noticing:
- Better collaboration. Teams can share, edit, and version diagrams using simple text. No more emailing huge files back and forth.
- Documentation that lives and breathes. Mermaid diagrams can be embedded directly inside Markdown documents, GitHub repositories, Notion pages, or any number of modern tools. The diagram updates with the document, so it stays in sync.
- Empowering non-designers. Marketers, founders, project managers, and ordinary team members can now create visuals without depending on a design team. The bottleneck disappears.
In a world that’s becoming more data-driven by the year, tools that make visual communication easier and more accessible matter more than they sound.
A useful companion tool
If you’d rather skip the code entirely and have an AI generate visuals from your existing text content, Napkin is worth a look. It transforms paragraphs of text into diagrams, charts, scenes, and images automatically. Think of it as a visual collaborator that can take rough thinking and turn it into something publishable.
Different tools fit different needs. Mermaid is excellent when you want full control over a structured diagram. Napkin is excellent when you want speed and visual variety from existing content.
Communication as a competitive advantage
The leaders, entrepreneurs, and communicators who stand out in the next few years won’t necessarily be the ones with the most information. They’ll be the ones who can take complex ideas and make them clear. Visuals are one of the highest-leverage tools available for doing that.
Start small. Pick one process you’d struggle to explain in words, and try mapping it as a Mermaid diagram. Then another. Within a couple of weeks you’ll have a new tool in your kit that pays back the small learning investment many times over.
So what’s one idea, process, or piece of work you’ve been struggling to explain in words, and what would change if you tried mapping it visually this week?